 Journal of Medical Research and Surgery
PROVIDES A UNIQUE PLATFORM TO PUBLISH ORIGINAL RESEARCH AND REMODEL THE KNOWLEDGE IN THE AREA OF MEDICAL AND SURGERY
Journal of Medical Research and Surgery
PROVIDES A UNIQUE PLATFORM TO PUBLISH ORIGINAL RESEARCH AND REMODEL THE KNOWLEDGE IN THE AREA OF MEDICAL AND SURGERY
Journal of Medical Research and Surgery
PROVIDES A UNIQUE PLATFORM TO PUBLISH ORIGINAL RESEARCH AND REMODEL THE KNOWLEDGE IN THE AREA OF MEDICAL AND SURGERY
Journal of Medical Research and Surgery
PROVIDES A UNIQUE PLATFORM TO PUBLISH ORIGINAL RESEARCH AND REMODEL THE KNOWLEDGE IN THE AREA OF MEDICAL AND SURGERY


 Indexed Articles
Select your language of interest to view the total content in your interested language
F. Mokeddem, Fadia Meziani, L. Hamza Cherif, SM Debbal*
Genie-Biomedical Laboratory (GBM), Department of Genie-Biomedical, Faculty of Technology, University of Aboubekr Belkaid-Tlemcen, BP 119, Tlemcen, Algeria
Correspondence to: SM Debbal, Genie-Biomedical Laboratory (GBM), Department of Genie-Biomedical, Faculty of Technology, University of Aboubekr BelkaidTlemcen, BP 119, Tlemcen, Algeria; E-mail: adebbal@yahoo.fr
Received date: October 17, 2020; Accepted date: October 28, 2020; Published date: November 4, 2020
Citation: Mokeddem F, Meziani F, Cherif LH, et al. (2020) The Impact of Murmur’s Severity on the Cardiac Variability. J Med Res Surg 1(6): pp. 1-6. doi:10.52916/jmrs204030
Copyright: ©2020 Mokeddem F, et al. This is an open-access article distributed under the terms of the Creative Commons Attribution License, which permits unrestricted use, distribution and reproduction in any medium, provided the original author and source are credited.
Phonocardiogram (PCG) signal is one of the useful approach to explore cardiac activity, and extract many features to help researchers to develop technic that may serve medical stuff to the diagnosis of several cardiac diseases. For people when it comes to a heart activity problem it is a serious health matter that need special care. In this paper, the importance is given to heart murmurs to highlight their impact. Heart murmurs are very common disease in world and depend on their severity they could be life-threatening point; therefore, the purpose of this paper is focused on three essential steps: first is to design an algorithm to extract only heart murmurs from a pathological Phonocardiogram (PCG) signal as a basic background to the whole work. Than calculate their severity based on Energy Ratio (ER) which is recommended by recent studies as an effective factor, in order to classify them to mild, medium and severe murmurs. In other hand, this classification will served to study the impact of severity of systolic and diastolic murmurs on cardiac variability, which is very important indicator on general health of human body. This study is done on consider number of patients and its reveal on very interesting results.
Severity, Energy ratio, Cardiac variability, Cardiac frequency, Phonocardiogram signal, Murmur, Detection, Duration
Phonocardiogram signal is the graphical representation for the audible heart sounds commonly known as heartbeats; a normal representation is composed by two main sound S1 and S2. The sound S1 corresponding to the beginning of the ventricular systole is due to the closure of the atrioventricular valves. This sound is composed of four internal components, two of which are the mitral component M1 (associated with mitral valve closure) and the tricuspid component T1 (associated with the closure of the tricuspid valve). The sound S2, which marks the end of the ventricular systole and signifies the beginning of the diastole, is composed of two main components: the aortic component A2 (corresponding to the closure of the aortic valve) and the pulmonary component P2 (corresponding to closure of the pulmonary valve) [1-3].
A heart murmurs any sound in the heart region other than normal heart sounds; common causes include movement of blood through narrowed or stenosis heart valves and blood leaking through a valve that does not close properly. In many cases a murmur may be of the innocent or functional type, with no heart disease at all, so that it causes no trouble; this type is only sporadically present and in time may go away completely [4]. The following figure represents the difference between a normal heart sounds and PCG affected by murmurs. Systolic murmur: occurs during a heart muscle contraction. Systolic murmurs are divided into ejection murmurs (due to blood flow through a narrowed vessel or irregular valve) and regurgitant murmurs. Diastolic murmur: occurs during heart muscle relaxation between beats. Diastolic murmurs are due to a narrowing (stenosis) of the mitral or tricuspid valves, or regurgitation of the aortic or pulmonary valves [A].
Murmurs are not all time harmless and in some cases are very dangerous and need an emergency medical intervention that’s why a huge importance is given in this paper to determine the severity of the murmurs and their impact on the cardiac variability. An algorithm has been designed to extract features to better understand this phenomena, this algorithm is founded on two essential steps: murmurs extraction and severity calculation.
Murmurs extraction has been done on previous work [5] by calculating the average Shannon energy envelop in order to set the beginnings and ends of heart sounds and heart murmurs and isolate individual sounds (S1 or S2) and hold only murmurs as shown in Figure 4.
The separating approach of phonocardiogram signal components proposed here, consists about detecting the envelope of the temporal energy of the cardiac sounds. The lobes of the temporal energy of the PCG signal are correlated with intracardiac events. Shannon’s energy makes it possible to better represent the oscillations of small amplitudes by avoiding their exhaustion in favor of those of higher values [5].
The cardiac sound separation algorithm depends essentially on the detection of the standardized average Shannon energy envelope for the identification of the beginnings and ends of cardiac sounds S1 and S2. This envelope detection is done by a low-pass filter with a cut-off frequency range from [10-40] Hz chosen empirically. The low pass filter is of Finite Impulse Response (FIR: Finite Impulse Response) [6]. The filtering procedure makes it possible to attenuate the oscillations of high frequencies while preserving only the morphology of the signal PCG.
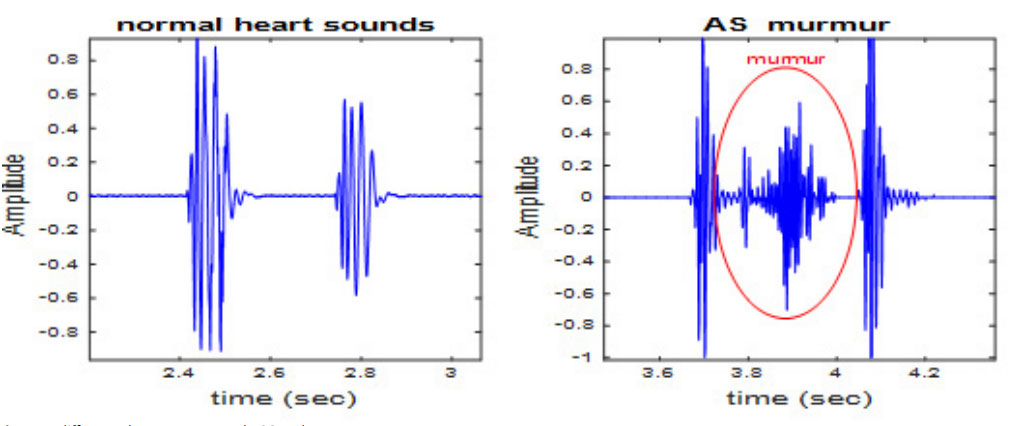 Figure 1: difference between a normal PCG and a supervene murmur.
The standardized average Shannon energy envelope with filtering of 20 Hz seems the most appropriate comparing to different cutoff frequencies [5]. The separation of heart sounds and heart murmurs is essentially based on the detection of the lateral minima of each peak of the energy envelope by the application of a threshold which will be fixed empirically from the maximum value (Figure 2), then detect the instants of these points and consequently the localization of the heart sounds and heart murmurs. The choice of threshold is also important for detection of the heart murmurs. Thus, for each heart murmur, one chooses a precise threshold. Their identification follows the same method. Similar to the separation of the cardiac sounds S1 and S2, the separation of heart clicks or heart murmurs requires detection of the side minima of each peak of the energy envelope of PCG signals with heart clicks or murmurs by applying a fixed threshold starting from the maximum value, and then detection of the moments of these points and consequently localization of the heart clicks or heart murmurs [5]. The flowchart given by the figure bellow shows the whole segmentation process, which consists of two essential parts.
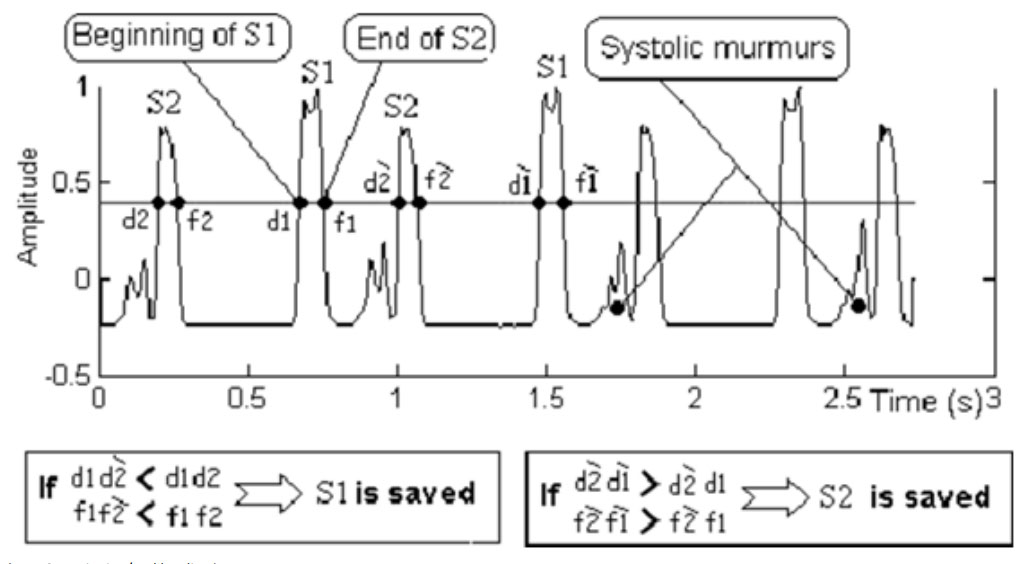 Figure 2: Beginning/end localization.
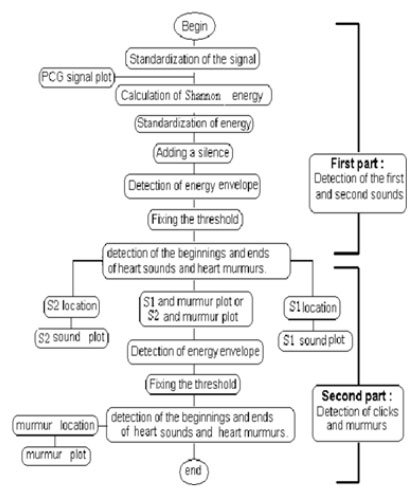 Figure 3: Separation algorithm
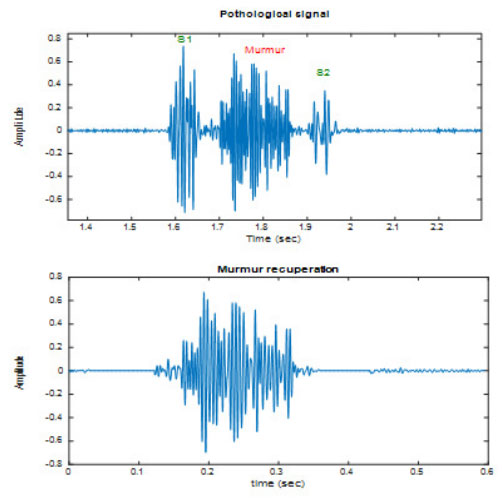 Figure 4: Murmur extraction.
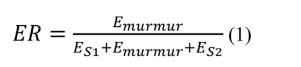
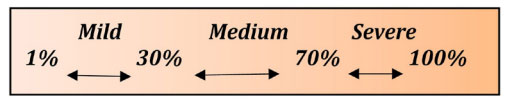
Once murmurs are extracted, we classify them according to their severity. They are many techniques to calculate severity [7] used gradient of pression and blood velocity nevertheless this technique shows some limitations because of its dependence on transvascular flow, in the same context the American Heart Association (AHA) and the American College of cardiology (ACC) recommend to use valvular area to quantify the severity [8] but this parameter may tend to overestimate the severity and its need a specific care during patient examination, D Kim et al. reached to measure duration of murmur at 300 Hz across a PCG time-frequency representation in order to define severity [9] but this technique still not give all about murmurs because chronology doesn’t reflect the intensity of murmur that’s why in paper we try to proceed a method that explore the real severity of the murmur. Severity calculation process is built on energy calculation as an important factor to define the total presence of murmur on the cardiac cycle by compare it to the energy of the other major sounds S1 and S2. Based on previous studies [10-12] that have been shown that energy ratio is a fair clue and useful argument for severity classification (Table 1), energy ratio ER is given by the following equation:
| Subjects | ER % | Cycle duration (second) | Cardiac frequency Fc (Hz) | Severity |
|---|---|---|---|---|
| 1 | 93.49 | 0.2477 | 4.03 | Severe |
| 2 | 91.5 | 0.2489 | 4.01 | Severe |
| 3 | 90 | 0.2521 | 3.93 | Severe |
| 4 | 89 | 0.258 | 3.87 | Severe |
| 5 | 62 | 0.7863 | 1.2718 | Medium |
| 6 | 49.8 | 0.8722 | 1.1494 | Medium |
| 7 | 48.4 | 0.7863 | 1.2728 | Medium |
| 8 | 48.2 | 0.6562 | 1.5352 | Medium |
| 9 | 36.23 | 0.8688 | 1.1513 | Medium |
| 10 | 36.05 | 0.8677 | 1.1524 | Medium |
| 11 | 22 | 0.9684 | 1.0327 | Mild |
| 12 | 13.47 | 0.7875 | 1.2698 | Mild |
| 13 | 13.12 | 0.776 | 1.2886 | Mild |
| 14 | 11.13 | 0.7627 | 1.3111 | Mild |
| 15 | 3.33 | 0.7475 | 1.3411 | Mild |
Database of cardiac abnormalities of heart sounds was taken from [B-C]. The abbreviations of PCG signals used in this study and their sampling frequencies are given in Table 2.
| PCG signals | Abreviation | Sampling frequency (Hz |
|---|---|---|
| Aortic Stenos | AS | 22050 |
| Systolic Mitral Prolapse | SMP | 11025 |
| Mitral Stenosis | MS | 8012 |
| Aortic Regurgitation | AR | 8012 |
in order to figure out the impact of severity on cardiac variability, witch is defined as the cardiac frequency the inverse of duration T between two successive peaks of the first sound S1 (Figure 5) as given by the equation below: The duration of the cardiac cycle depends on the heart rate Bpm (beat per minute). For example, if the heart rate is 60 per minute, the duration of the cardiac cycle will be 1 sec. There is an inverse relationship between the duration of the cardiac cycle and the heart rate. Therefore, when the heart rate increases to 120 beats per minute, the cardiac cycle time will be approximately 0.5 sec. [13] The cardiac duration can be calculated theoretically by the following relation: Cardiac duration = 60/Bpm ……..(3) (Where Bpm is the number of beats per minute.) For a healthy adult, at rest the average heart beat is 75 Bpm and for this the cardiac cycle time is 0.8 sec and Fc = 1.25 Hz (theoretically). The cardiac frequency for a normal person who present no pathology has been calculated and it is around: 1.2475 Hz (the average value) and the following results in the table bellow will be compared by this value. It should also be noted that the resting heart rate is not constant over 24 hours because of the different biological cycles. It is at most aroundnoon. Digestion, heat and cold cause an increase in heart rate. The theoretical value is very close to the values found by the application of our algorithm on various normal PCG signals analyzed. Figures from 6 to 9 show the attitude of cardiac frequency in accordance with severity into two axis:
Systolic murmurs:AS case and SMP case.
Diastolic murmurs:MS case and AR case.
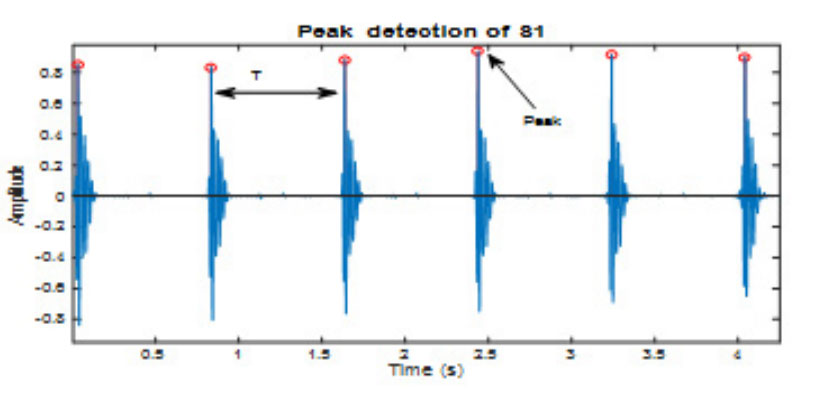 Figure 5: Cardiac cycle duration calculation.
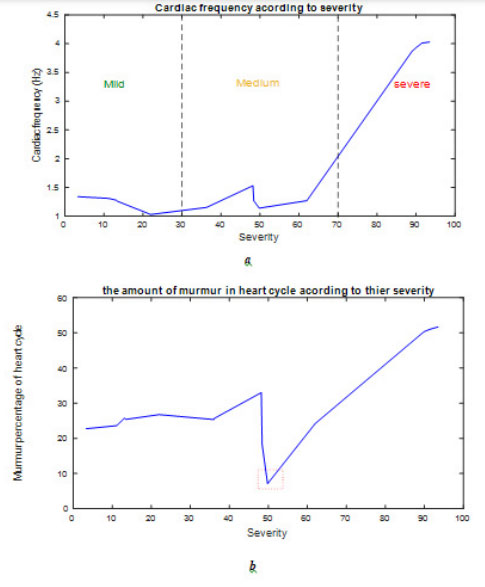 Figure 6(a): Cardiac frequency according to severity for AS case; b). The
amount of murmur in heart cycle according to severity for AS case.
Figure 6(a): Cardiac frequency according to severity for AS case; b). The
amount of murmur in heart cycle according to severity for AS case.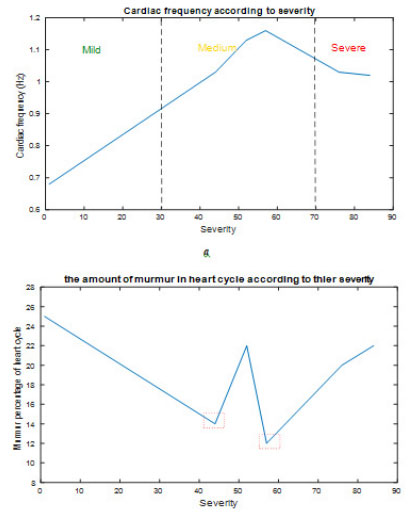 Figure 7(a): Cardiac frequency according to severity for SMP case; b). The
amount of murmur in heart cycle according to severity for SMP case.
Figure 7(a): Cardiac frequency according to severity for SMP case; b). The
amount of murmur in heart cycle according to severity for SMP case.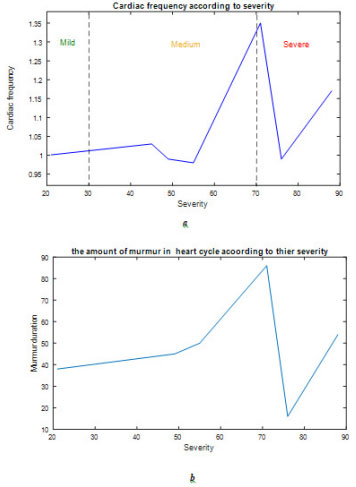 Figure 8(a): Cardiac frequency according to severity for MS case; b). The
amount of murmur in heart cycle according to severity for MS case.
Figure 8(a): Cardiac frequency according to severity for MS case; b). The
amount of murmur in heart cycle according to severity for MS case.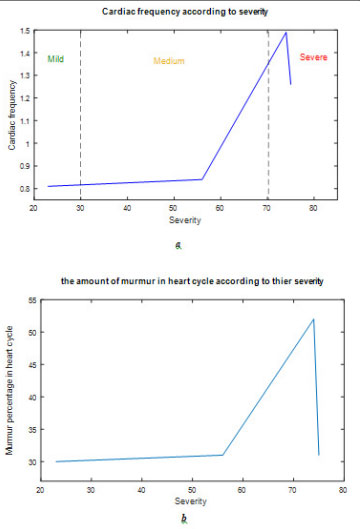 Figure 9(a): Cardiac frequency according to severity for AR case; b). The
amount of murmur in heart cycle according to severity for AR case.
Figure 9(a): Cardiac frequency according to severity for AR case; b). The
amount of murmur in heart cycle according to severity for AR case.This study reveals on very interesting results can be arranged on three points: severity of murmur calculation, the impact of this severity on cardiac variability and the link between murmur duration over heart cycle and its severity. Table.1 reflects the efficiency of using energy ratio RE as procedure to define the stage of heart pathologies from mild and medium to severe pathology that needs to pay attention and have special care or an emergency medical intervention in some cases.
Cardiac variability presented by cardiac frequency is normally fluctuate around 1.2475 Hz for healthy persons and murmurs in general way will affect this variability: according to figure 6(a) cardiac frequency in As case it’s not hugely affected until the murmur becomes severe where it’s jump to highest values, which means noticeable heartbeats and uncomfortable symptoms according to [D] heart becomes weak and needs to work harder to pump blood through the body, experts classify severe AS as a serious matter because it’s related to the aortic valve damage and it could reach to a life-threatening point. In other hand cardiac frequency of SMP increase according to severity Figure 7(a), but it still under the average value of a normal case which led us to conclude that systolic murmurs severity affect cardiac variability by increasing her nevertheless each pathology acts on its own way on cardiac frequency.
For diastolic murmurs MS and AR presented by Figure 8(a) and Figure 9(a), they show specific attitude in their curve where the cardiac frequency is increasing to such point and decrease again, this apparition is generally between 60% to 70 % of severity, where the cardiac frequency is quite remarkable in this interval and out of this it’s slightly affected.
The amount of murmur in heart cycle presented in (Figures: 6(b), 7(b), 8(b) and 9(b) is calculated as a percentage by the following equation:

The point behind the determination of this feature is to figure out the if a long duration of a heart murmur means a severe stage of the pathology nevertheless curves in figures mentioned above show that even with short duration where the murmur takes small area in the heart cycle severity could be considerable, which confirm that murmur duration it’s not criterion to define severity
Heart murmurs are serious health matter in the entire world and phonocardiogram signal is a helpful approach to extract as much possible of information about murmurs. In this study, we tried to focus on severity and their impact on heart variability. Energy ratio shows its efficiency as an important process to calculate severity stage of heart murmur and classify them according to ER to mild, medium and severe murmurs. The study reveals on very interesting result concerning the influence of severity on cardiac frequency where systolic murmurs increase it with specific way to each case, however it should be noted that a severe AS case is hugely affecting the cardiac frequency which will conduct to serious cardiac health problems. In addition, pathologies with diastolic murmurs snatched attention by their particular variation of cardiac frequency on 60% to 70 % severity zone which due diastolic pathologies themselves.
As well as this study confirmed that murmur duration, it cannot be an adequate criterion to judge severity and it should be always checked by another method. All these results obtained can be further improved and reinforced if this statistical study can be done on a larger number of pathologies.


