 Journal of Medical Research and Surgery
PROVIDES A UNIQUE PLATFORM TO PUBLISH ORIGINAL RESEARCH AND REMODEL THE KNOWLEDGE IN THE AREA OF MEDICAL AND SURGERY
Journal of Medical Research and Surgery
PROVIDES A UNIQUE PLATFORM TO PUBLISH ORIGINAL RESEARCH AND REMODEL THE KNOWLEDGE IN THE AREA OF MEDICAL AND SURGERY
Journal of Medical Research and Surgery
PROVIDES A UNIQUE PLATFORM TO PUBLISH ORIGINAL RESEARCH AND REMODEL THE KNOWLEDGE IN THE AREA OF MEDICAL AND SURGERY
Journal of Medical Research and Surgery
PROVIDES A UNIQUE PLATFORM TO PUBLISH ORIGINAL RESEARCH AND REMODEL THE KNOWLEDGE IN THE AREA OF MEDICAL AND SURGERY


 Indexed Articles
Select your language of interest to view the total content in your interested language
Allyan FM1*, Abu Mustafa AM2, Zabut BM3, Adris MA4
1Department of Biochemistry, College of Medical Sciences, Israa University, Gaza, Palestine
2Department of Biochemistry, Faculty of Nursing, Ministry of Health, Gaza, Palestine
3Department of Biochemistry, Faculty of Science, Islamic University, Gaza,Palestine
4Department of Biochemistry, Faculty of Medicine, University of Al-Butana Sudan
Correspondence to: Allyan FM, Department of Biochemistry, College of Medical Sciences, Israa University, Gaza, Palestine; E-mail: faten48@hotmail.com
Received date: August 24, 2020; Accepted date: September 3, 2020; Published date: September 10, 2020
Citation: Allyan FM, Abu Mustafa AM, Zabut BM, et al. (2020) Association between Novel Biomarkers Galectin-3 and NT-BNP with Cardiovascular Complication in Type-2 Diabetic among Palestinian Patients-Gaza Strip. J Med Res Surg 1(5): pp. 1-7.
Copyright: ©2020 Allyan FM, et al. This is an open-access article distributed under the terms of the Creative Commons Attribution License, which permits unrestricted use, distribution, and reproduction in any medium, provided the original author and source are credited.
The number of patients with T2DM is progressively increasing all over the world, and one of the most severe chronic complications of diabetes is the development of Cardiovascular Disease (CVD). The burden of diabetes is now a huge Palestinian public health challenge increase substantially in the next two decades. The aim of the study to investigate the relationship between plasma Galactin-3 and NT-BNP level with the development of CVD in T2DM in Palestinian patients. Case-control study design, this study was conducted in the laboratory of Central laboratory in Remal Clinic, Gaza Strip-Palestine in the period from July to October 2018, included 180 subjects divided to the three groups control, T2DM patients and T2DM with CVD, 60 individual in each group, matching for age. Vacutainer serum and EDTA blood samples were collected from all participants for the laboratory analysis. These results showed that there were highly significant differences (P>0.01) in serum Galectin-3 level in the T2DM group compared with T2DM and CVD group, while NT-BNP results there was no significant difference between the T2DM group and T2DM with CVD group. Also, the study revealed that Galectin-3 was found to be more sensitive and specific by using Roc curve statistical test (sensitivity was 83.3%, specificity was 75.0%, p <0.01), than NT-BNP (sensitivity was 81.7%, specificity was 23.3% p >0.05) in predicting cardiovascular complications in T2DM patients We concluded that the Galectin-3 is the best novel biomarkers in comparison with NT-BNP that aid in the early diagnostic and prognostic evaluation either alone or in combination with other biomarkers for cardiovascular complications in a patient with T2DM
Galectin-3, NT-BNP, biomarkers, CVD, T2DM, Gaza strip
T2DM: Type-2 Diabetic Patients; CVD: Cardiovascular Disease; NT-BNP: N-Terminal Brain Natriuretic Peptide
Diabetes mellitus is a serious global cause of mortality and morbidity with significant raises in the prevalence and number of cases in the last 30 years [1]. The first WHO Global report on diabetes demonstrates that the number of adults living with diabetes has almost increased four-folds since 1980 to 422 million adults; this dramatic rise is largely due to the rise in T2DM and in, 2012 diabetes alone caused (1.5) million deaths [2]. The prevalence of diabetes in the Palestinian population in the West Bank, Gaza, and E. Jerusalem is high in the range of 15.3% compared to a worldwide prevalence of 6%.; the total diabetic population 95.3% are diagnosed with T2DM [3]. The incidence of diabetes in 2017 in the Gaza strip was 264.8/100,000 people, which increased by 7.21% for the year 2016 [4]. Therefore, the study of the novel biomarkers Galectin-3 and NT-BNP in early diagnosis of recently and complication of CVDs in T2DM is important. Recently found Galectin-3 has an important iso-type of Galectin family and has potential relations with CVD mortality and all-cause mortality beyond classical and novel biomarkers of CVD risk [5] and NT-BNP may be an important second biomarker to evaluate and screen the severity for cardiac disease in diabetic or pre-diabetic patients. These biomarkers are considered predictors of mortality and morbidity cardiac diseases [6].
Permission study was obtained from the Helsinki committee in the Gaza Strip in 2/10/2017; No. PHRC/HC/287/17) and admin approval was obtained from the human resource development general directorate in the Ministry of Health. Moreover, consent informed was gained from all participants before enrolment in the study after explained the study’s objectives and anonymity, right, and confidentially were saved.
The design of the study is a case-control cross-sectional.
The study was conducted in the Gaza strip- Palestine at the Central laboratory of Al-Remal clinic and conducted during the period from July to October 2018.
T The study population was comprised of patients with T2DM without CVD complications recruited from the outpatient clinic at the Diabetic Department of Remal Clinic Center in Gaza Strip and T2DM with CVD complications recruited from the Cardio Care Unit (CCU) at El-Shifa Hospital, Gaza. The Control group was an equal number of an age-matched and in-residence place.
In this study 180 subjects, their age ranged from 45-65 years, were selected and divided into three groups: group one include 60 healthy subjects as control, group two comprise 60 T2DM without cardiovascular disease recruited from the outpatient’s clinic at the diabetic clinic center and group three included 60 T2DM with cardiovascular disease recruited from the Cardio Care Unite at El-Shifa (CCU) at El-Shifa Hospital, Gaza. The venous blood sample was collected (about seven ml) was drawn into two vacationer tubes, two ml of the blood was left with anticoagulant (EDTA) in the first tube for HbA1C and five ml without anticoagulant in the second tube and was allowed to clot used for glucose, urea, creatinine, uric acid which is done by chemistry analyzer (Erba XL 200 manufactured by Erba Diagnostic Mannheim, Germany), also Galectin-3 and NT-BNP by Eliza kit (R and D company, U.S.A). These biochemical tests are done in the laboratory in the Remal clinic.
Statistical analysis was conducted using Statistical Package for Social Science (SPSS) version (22). The soft-Ware USA for windows. Descriptive statistics will be reported as Mean ± SD and ANOVA test to find the difference between three studied groups, if (P< 0.05) were considered statistically significant. As for diagnostic accuracy of Galectin-3, and NT-BNP as applied to CVDs, the researcher made receiver operating characteristic curve (ROC curve) and detected cut off value and Area Under Curve (AUC) to detect the ability of Galectin-3, and NT-BNP tests to discriminate between those individuals with the disease and those without the disease. Cut off values were selected at the highest true positive (sensitivity), with the lowest false positive (specificity). Also, sensitivity, specificity, accuracy, Positive Predictive Value (PPV), and Negative Predictive Value (NPV) were calculated.
Statistical analysis was conducted using Statistical Package for Social Science (SPSS) version (22). The soft-Ware USA for windows. Descriptive statistics will be reported as Mean ± SD and ANOVA test to find the difference between three studied groups, if (P< 0.05) were considered statistically significant. As for diagnostic accuracy of Galectin-3, and NT-BNP as applied to CVDs, the researcher made receiver operating characteristic curve (ROC curve) and detected cut off value and Area Under Curve (AUC) to detect the ability of Galectin-3, and NT-BNP tests to discriminate between those individuals with the disease and those without the disease. Cut off values were selected at the highest true positive (sensitivity), with the lowest false positive (specificity). Also, sensitivity, specificity, accuracy, Positive Predictive Value (PPV), and Negative Predictive Value (NPV) were calculated.
This study aimed to determine the relationship between novel chemistry biomarkers of the development of CVD in T2DM patients in the Gaza Strip. Table 1 summarizes the general demographic variables of three studied groups were contains 35 (58.3%) males and 25 (41.7%) females in the control group (Group 1), in T2DM without CVDs group two (Group 2) contained 38 (63.3%) males and 22 (36.7%), while T2DM with CVDs group (Group 3) contain 23 (38.3%) male and 37 (61.7%). The means age for the three were (53.8 ± 6.5, 53.9 ± 5.6), and (55.6 ± 6.9). There was no significant difference according to age; where the study sample matched for age. About BMI were (26.9 ± 3.2, 32.2 ± 6.6) and (32.4 ± 6.9) kg/m2 for control, T2DM without CVDs and T2DM with CVDs respectively The table also show the smoking variable, most participants are non-smoker category but it found 3.3 %,11.7 %, and 28.3% are a current smoker in the three studied, respectively. Also, the table shows mean levels of systolic/diastolic blood pressure were 114.8 ± 5.7/128.8 ± 15.7, 126.3 ± 8.7, and 74.3 ± 6.1/84.3 ± 11.4/81.7 ± 6.2 mmHg for group one, group two, and group three; respectively (Table 1-4).
Table 1: Characteristics and demographic data of the study population| Variables | Group 1 | Group 2 | Group 3 | p-value |
|---|---|---|---|---|
| Gender | ||||
| Male N (%) | 35 (58.3) | 38 (63.3)2 | 23 (38.3)2 | 0.014* |
| Female N (%) | 25 (41.7) | 22 (36.7) | 37 (61.7) | |
| Age by years | ||||
| Mean ± SD | 53.8 ± 6.5 | 53.9 ± 5.6 | 55.6 ± 6.9 | 0.197NS |
| Range | (45-65) | (45-65) | (45-65) | |
| BMI (kg/m2 ) | ||||
| Mean ± SD | 26.9 ± 3.21&3 | 32.2 ± 6.61 | (19¬44.9 | 0.000** |
| Range | (22-33.4) | (19-44.9) | (23-57.8) | |
| Smoking | ||||
| Non-smoker | 55(91.7)1&2 | 34(56.7)1 | (56.7)2 | 0.000** |
| Past-smoker | 3(5) | 19 (31.7) | 9(15) | |
| Current-smoker | 2(3.3) | 7 (11.7) | 17(28.3) | |
| Systolic blood pressure (mmHg) | ||||
| Mean ± SD | 114.8 ± 5.71& | 128.8±15.71 | 126.3 ± 8.72 | 0.000** |
| Range | (100-120) | (105-180) | (100-150) | |
| Diastolic blood pressure | ||||
| Mean ± SD | 74.3 ± 6.11&2 | 84.3 ± 11.41 | 81.7 ± 6.22 | 0.000** |
| Range | (60-80) | 65-130) | (70-95) | |
| Parameters | Group 1 | Group 2 | Group 3 | F | p-value |
|---|---|---|---|---|---|
| HbA1C (%) | |||||
| Mean ± SD | 5.8 ± 0.41&2 | 7.8 ± 1.21 | 8.2± 1.2 | 98.911 | 0.000** |
| Range | 4.8¬6.3 | 6.0-10.3 | 6.0-11.3 | ||
| FBG (mg/dl) | |||||
| Mean ± SD | 91.7 ± 11.81&2 | 173.6 ± 88.31 | 186.8 ± 64.72 | 39.453 | 0.000** |
| Range | 64-115 | 70-469 | 91-393 | ||
| Urea (mg/dl) | |||||
| Mean ± SD | 28 ± 8.41&2 | 36 ± 161 | 42.9 ± 23.42 | 11.798 | 0.000** |
| Range | 15-47 | 15-81 | 21-142 | ||
| Creatinine (mg/dl) | |||||
| Mean ± SD | 0.7 ± 0.21&2 | 0.9 ± 0.61 | 1.2 ± 0.52 | 14.265 | 0.000** |
| Range | 0.4-1 | 0.5-3.2 | 0.7-4.2 | ||
| Uric acid (mg/dl) | |||||
| Mean ± SD | 4.0 ± 1.23 | 4.8 ± 1.7 | 5.2 ± 1.53 | 9.933 | 0.000** |
| Range | 2.1-8.1 | 2.1-8.1 | 2.5¬8.7 | ||
| (Similar number between two groups means significant difference, p*: Significant p**: Highly significant, NS: Non-significant) | |||||
Table 2 illustrate the mean levels of HbA1c, serum glucose, urea, creatinine and uric acid among three studied groups showed that the means levels of HbA1c were 5.8 ± 0.4, 7.8 ± 1.2, and 8.2 ± 1.2 % and that of serum glucose was 91.7 ± 11.8, 173.6 ± 88.3 and 186.8 ± 64.7 mg/dl and mean level of urea were 28 ± 8.4, 36 ± 16 and 42.9 ± 23.4 for group one, group two and group three, respectively. There were statistically significant differences (p< 0.01) of the means for both HbA1c, serum glucose, and urea among three studied groups. There was a significant difference in group two and group three (p< 0.05) compared to the control group, while there was no significant difference between group two compared with group three for HbA1c, glucose, and urea. These result agreement with the study of Cavero et al. [7], Nguyen et al. [8], and Kishimoto et al. [9] studies, which indicated that HbA1c and glucose levels contribute in predict cardiovascular disease, and also agreement with Abdelsalam et al. [10], who study that showed highly urea level accompanied with cardio-diabetic complication. Mean of serum creatinine were 0.7 ± 0.22, 0.9 ± 0.6, and 1.2 ± 0.5 mg/dl for the three studied groups respectively. There was a significant difference in serum creatinine in group three compared to the control group, but there was no significant difference between groups two and three of these results agreement with Gautam et al. [11], who showed an independent influence of elevated creatinine on cardiovascular diseases morbidity and mortality. On the other hand, the mean levels of serum uric acid gradually increased by 4.0 ± 1.2, 4.8 ± 1.7, and 5.2 ± 1.5 mg/dl for the three groups respectively. There were significant differences only in uric acid between the control group and group three (p< 0.05) these results agree with the majority of studies found a significant interrelationship between hyperuricemia and cardiovascular outcomes [12-15]. These findings support the evidence indicating that subtle impairment of renal function may be a factor for increased risk of CVDs.
Table 3, Figures 1 and 2 demonstrate the mean levels of serum Galectin-3 and NT- BNP among three studied groups. Serum Galectin-3 mean levels were showing an increase of 6.0 ± 2, 15.4 ± 4.9, and 25.7 ± 10.5 ng/ml in group one (control), group two, and group three respectively. The results showed a highly significant difference in the levels of serum Galectin-3 among
Table 3: Serum Galectin-3 and NT-BNP in the studied groups.| Variables | Group 1 | Group 2 | Group 3 | F | p-value |
|---|---|---|---|---|---|
| Galectin-3 | |||||
| Mean±SD | 6.0 ± 21&2 | 15.4 ± 4.91&3 | 25.7 ± 10.52&3 | 124.651 | 0.000** |
| Range | 2.3 ¬ 10.1 | 10.0 ¬ 38.3 | 10.3 ¬ 49.7 | ||
| NT-BNP | |||||
| Mean±SD | 72.9 ± 45.21&2 | 334.3 ± 121.81 | 306.2 ± 100.62 | 137.383 | 0.000** |
| Range | 21.7-181.9 | 73.6-593.1 | 138.2 -553.5 | ||
| (Similar number between two groups means significant difference, p*: Significant p**: Highly significant, NS: Non-significant) | |||||
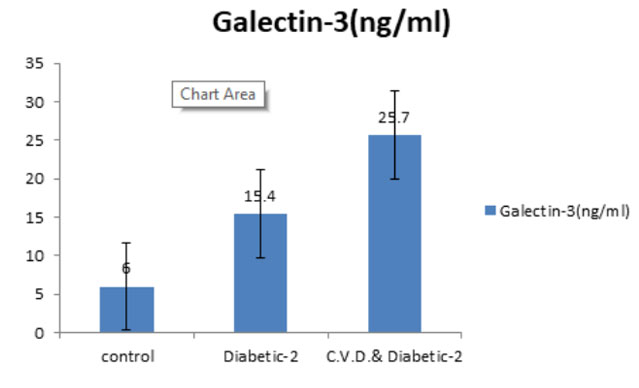 Figure 1: Galectin-3 level in the studied groups.
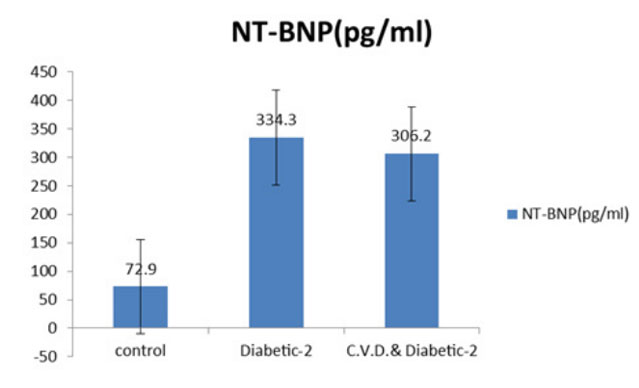 Figure 2: NT-BNP level in the studied groups.
the three groups (p< 0.01). Post-hoc of ANOVA test revealed a highly significant difference (p< 0. 01) between group one with group two and group three this results in agreement with Ozturk et al. [16], who found that Galectin-3 was a novel and important biomarker that help T2DM patient, who require early Coronary Artery Diseases (CAD) intervention because of the potential risk of coronary atherosclerosis and Galectin-3 concentrations were significantly higher in the CAD group than in the non-CAD group. Also, the agreement of the results with Jansen et at. [17], whom study that revealed Galectin-3 has emerged as a potential useful novel biomarker for heart failure and cardiovascular diseases., this result also harmonized with Hrynchyshyn et al. [18], who found that a significantly increased level of serum Galectin-3 in patients with heart diseases. As for the serum NT-BNP results, means was 72.9 ± 45.2 and 334.3 ± 121.8 and 306.2 ± 100.6 pg/ml among group one, group two, and group three respectively, it is noted that the mean of NT-BNP was higher in the second group than the third group, this indicates that NT-BNP is not only a diagnostic of CVD but influenced by other factors in T2DM patients. The results showed a highly significant difference in the levels of serum NTBNP among three studied groups (p< 0.01). Post-hoc of ANOVA test was clarified a highly significant difference between control with group two and group three (p< 0.001), in the same time there were no significant difference found between group two and group three, this indicated that NT-BNP should not be used alone diagnostic biomarkers for CVD, it should be used with Galectin-3 or other confirmative biomarkers to give the early diagnosis of cardiac diseases in T2DM.
Our results agreement with Görmüs et al. [19] that found NT-BNP levels known to be elevated in T2DM patients with asymptomatic diastolic dysfunction, also agreement with Gidding et al. [20] who found that NT-BNP biomarkers elevated serum concentrations of cardiac diseases were common in T2DM in presence of risk factors and disagree with Thygesen et al. [21], who showed that the half-life on NT- BNP was about 60-90 minutes and the concentrations of NT-BNP inversely correlate with the glomerular filtration rate and increase with age, therefore it is not specific for cardiac diseases and preferred Galectin-3 because it has advantages as more stable and acts as an early indicator of cardiac risk, also results of the study agreement with Amin et al. [22]. These results indicate that serum Galectin-3 may be used as a biomarker either alone or in combination with other biomarkers, for the progression of CVD in T2DM.
In the present study, the Receiver Operating Characteristic curve (ROC curve) was detected cut off value for Galectin-3 and NT-BNP for diagnostic CVDs in group three compared to the control group. The cut-off value for Galectin-3 that predicting CVD in controls was 10.2 ng/ml, the Area Under Curve (AUC) was 1.000 (p< 0.001), sensitivity and specificity were 100 %. Positive Predictive Value (PPV) was 100%, Negative Predictive Value (NPV) was 100%, and accuracy also was 100% to diagnostic CVDs. The cut-off value for NT-BNP was 162.2 pg/ml, the AUC was 0.996 (p< 0.001), sensitivity was 98.3%, specificity was 93.3%, PPV was 93.7, NPV was 98.2, and accuracy was 95.8% to diagnostic CVDs (Table 4 and Figure 3).
| Biomarker | T2DM with CVD (n=60) | Controls (n=60) | Cut-off point | Sensitivity (%) | Specificity (%) | PPV (%) | NPV (% | Accuracy (%) | AUC (95% CI) | P value |
|---|---|---|---|---|---|---|---|---|---|---|
| Galectin-3 (ng/ml) | 0 | 60 | < 10.2 | 100 | 100 | 100 | 100 | 100 | 1 (1.000- 1.000) | < 0.001 |
| 60 | 0 | >10.2 | ||||||||
| NT-BNP (pg/ml) | 1 | 56 | < 162.2 | 98.3 | 93.3 | 93.7 | 98.2 | 95.8 | 0.996 (0.989- 1.000) | < 0.001 |
| 59 | 4 | >162.2 | ||||||||
| n: number of subjects; PPV: Positive Predictive Value; NPV: Negative Predictive Value; AUC: Area Under the Curve; 95%CI: 95% Confidence Interval; **p- value significant at p < 0.01, NS: Non-significant | ||||||||||
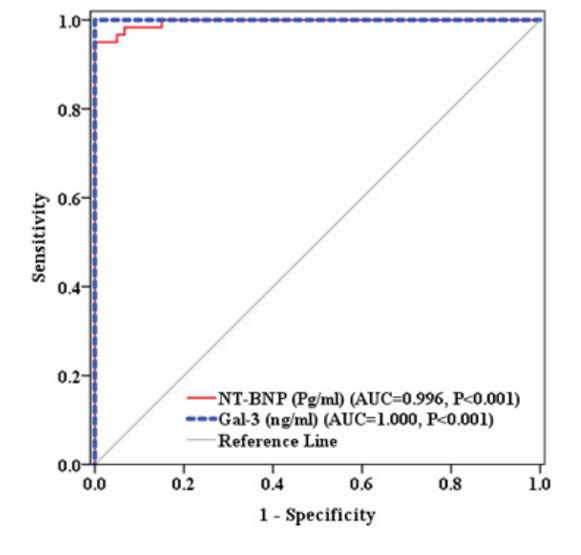 Figure 3: ROC curve for predicting CVDs in control
On the other hand, Galectin-3 and NT-BNP were highly statistically significant (p< 0.001) to diagnostic CVDs for group three compared to group two. The cut-off value for Galectin-3 that predicting CVD in T2DM was 17 ng/ml, AUC was 0.866 (p< 0.001), sensitivity was 83.3 %, specificity was 75.0 %, PPV was 76.9 %, NPV was 81.8, and accuracy was 79.2 % to diagnostic CVDs. Additionally, the cut off value for NT-BNP was 222 pg/ml, the AUC was 0.417 (P< 0.001), sensitivity was 81.7%, specificity was 23.3%, PPV was 51.6 %, NPV was 56.0 %, and accuracy was 52.5% to diagnostic CVDs (Table 5 and Figure 4).
| Biomarker | T2DM with CVD (n=60) | Controls (n=60) | Cut-off point | Sensitivity (%) | Specificity (%) | PPV (%) | NPV (%) | Accuracy (%) | AUC (95% CI) | P value |
|---|---|---|---|---|---|---|---|---|---|---|
| Galectin-3 (ng/ml) | 10 | 45 | < 17.0 | 83.3 | 75 | 76.9 | 81.8 | 79.2 | 0.866 (1.000- .000) | < 0.001 |
| 50 | 15 | >17.0 | ||||||||
| NT-BNP (pg/ml) | 11 | 14 | < 222.1 | 81.7 | 23.3 | 51.6 | 56 | 52.5 | 0.417 (0.313- 521) | < 0.118 NS |
| 49 | 46 | >222.1 | ||||||||
| n: number of subjects; PPV: Positive Predictive Value; NPV: Negative Predictive Value; AUC: Area Under the Curve; 95%CI: 95% Confidence Interval; **p- value significant at p ≤ 0.01, NS: Non-significant | ||||||||||
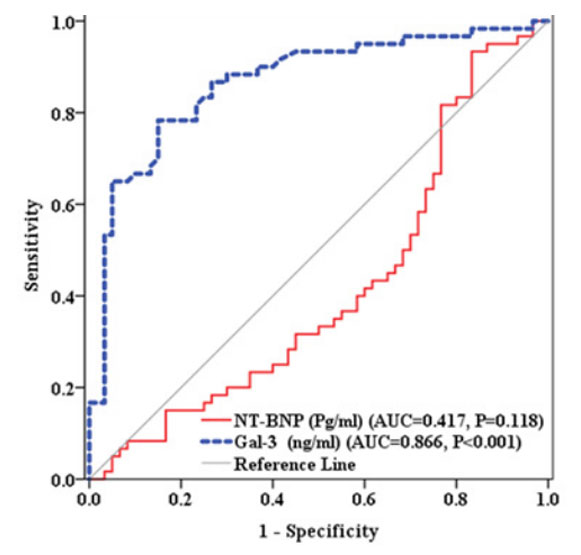 Figure 4: ROC curve for predicting CVDs in T2DM.
Another study by Amin et al. [22] showed similar results of the current study in the cut-off values of Galectin-3 levels, also the study revealed that Galectin-3 test powerful for diagnosing acute heart failure. While van der Velde et al. [25] and Meijers et al. [26] disagree with the current study result that Galectin-3 was complementary diagnostic biomarkers with NT-BNP, but the study concise with current study results that Galectin-3 is a novel biomarker,it is a prognostic marker in heart failure and cardiac dysfunction of patients characteristics, renal and cardiac function.
Ho JE et al. [27] and Weir et al. [28] showed that the Galectin-3 provide a novel biomarkers in heart failure prognosis stratification and are strongly correlated with elevated risk for new heart failure in healthy people and acute myocardial infarction.
Thygesen et al. [21] showed that the half-life on NT- BNP was about 60-90 minutes and the concentrations of NT-BNP inversely correlate with the glomerular filtration rate and increase with age, therefore Galectin-3 has advantages as more stable and act as an early indicator of cardiac risk. Another study noted that Galectin-3 had a more important role in the beginning stage of heart failure including early fibrosis and ventricular remodeling in comparison with NT-BNP levels which affect by hemodynamic loading, also Galectin-3 has the advantage to be more stable and resistance due to the close-related pathophysiology of cardiac and renal impairment, indicator cardio-renal syndrome [22].
We concluded that Galectin-3 and NT-BNP are involved in the cardiac processing pathway, these biomarkers levels are closely related to the severity of diabetes in T2DM with and without cardiovascular complications, but the relationship between Galectin-3 and CVDs was and more sensitive and specific than NT-BNP in diabetic patients with cardiovascular complications and without cardiovascular complications due to the closerelated pathophysiology of cardiac. Therefore, the monitoring of Galectin-3 in complementary with NT-BNP levels can play an important role in the management of diabetic cardiovascular complications.
Introducing the Galectin-3 test as sensitive and specific biomarkers of CVDs, in complementary with NT-BNP, which provide potential additive valuable prognostic information, progress patient care, and these novel biomarkers be used to screen the risk assessment of CVDs in T2DM patients is recommended. Also, Future investigations that use the Galectin-3 biomarker in other diagnostic pathways are recommended.

