 Journal of Clinical and Biomedical Investigation
PROVIDES A UNIQUE PLATFORM COVERING SCIENTIFIC KNOWLEDGE IN BIOMEDICAL SCIENCES AND CLINICAL RESEARCH
Journal of Clinical and Biomedical Investigation
PROVIDES A UNIQUE PLATFORM COVERING SCIENTIFIC KNOWLEDGE IN BIOMEDICAL SCIENCES AND CLINICAL RESEARCH
Journal of Clinical and Biomedical Investigation
PROVIDES A UNIQUE PLATFORM COVERING SCIENTIFIC KNOWLEDGE IN BIOMEDICAL SCIENCES AND CLINICAL RESEARCH
Journal of Clinical and Biomedical Investigation
PROVIDES A UNIQUE PLATFORM COVERING SCIENTIFIC KNOWLEDGE IN BIOMEDICAL SCIENCES AND CLINICAL RESEARCH
Mona A. Amin1* , Halla M. Ragab2 , Nabila Abd El Maksoud2 , Wafaa Abd Elaziz2
1Department of Internal Medicine, Kasr Al-Aini, Cairo University, Egypt
2Department of Biochemistry, Biotechnology Research Institute, National Research Centre, Dokki, Giza, Egypt
Correspondence to: Mona A. Amin, Department of Internal Medicine, Kasr Al-Aini, Cairo University, Egypt
Received date: April 09, 2022; Accepted date: April 25, 2022; Published date: May 02, 2022
Citation: Amin MA, Ragab HM, El Maksoud NA, et al. (2022) Clinical Significance of Serum CD14 and Its Polymorphism as a Biomarker of Non-Alcoholic Fatty Liver
Disease. J Clin Biomed Invest 2(1): pp. 15-23. doi: 10.52916/jcbi224013
Copyright: ©2022 Amin MA, et al. This is an open-access article distributed under the terms of the Creative Commons Attribution License, which permits
unrestricted use, distribution and reproduction in any medium, provided the original author and source are credited.
Background: Liver inflammation is deliberated a risk factor for the ongoing liver damage including non-alcoholic steatohepatitis, cirrhosis, and hepatoma. CD14, an effectual mediator for the monocytes activation, has been postulated as a marker of liver inflammation and fibrosis. This study is constructed to detect the alterations in the CD14 serum levels in 40 NAFLD cases and 14 healthy controls along with to analyze the role of CD14 polymorphisms in the causation and severity of Non-Alcoholic Fatty Liver Disease (NAFLD). Liver enzymes, glycated hemoglobin, together with lipid profile were estimated in all included subjects. The diagnosis of NAFLD depends largely on ultrasonography. NAFLD fibrosis score and FIB-4 score were calculated. Serum CD14 was quantified by EnzymeLinked Immunosorbent Assay (ELISA) and C14-159C/T SNP was genotyped via Polymerase Chain Reaction (PCR) and Restriction Fragment Length Polymorphisms (RFLP).
Results: Serum CD14 was markedly higher in the diabetic subjects either lean or overweight/obese than the controls (P<0.05). Receiver Operating Characteristic (ROC) curve showed that the optimum cutoff for CD14 was 2.97 ng/ml for discriminating NAFLD patients from their healthy counterparts with a sensitivity of 76.3% and specificity of 78.6%. There was no discrepancy in the prevalence of CD14 genotypes among NAFLD cases and controls. Moreover, the frequency of the CD14 genotypes was analogous in NAFLD patients with NFS≤0.676 and patients with NFS>0.676 (P=1.000).
Conclusion: The former observations advocate the potential role of CD14 in both the pathogenesis and progression of NAFLD. Yet, it didn't correlate with the NFS, consequently it couldn't forecast the severity of the disease. Furthermore, no association was distinguished linking CD14 C-(159) T polymorphism and the risk of NAFLD occurrence.
CD14, NAFLD, Gene polymorphism, NAFLD fibrosis score, FIB-4
NAFLD, a widely prevalent hepatic metabolic disorder worldwide, is afflicting approximately a quarter of the adult population [1]. It is the foremost trigger of liver function tests aberrations with an extra risk in people suffering from obesity, type II diabetes (T2DM), hypertension, and/or metabolic syndrome [2,3]. NAFLD may proceed from a benign histological disease phase labelled Simple Steatosis (SS) or Non-Alcoholic Fatty Liver (NAFL) and distinguished by plain fat buildup to a farther severe histological figure entitled Non-Alcoholic Steato Hepatitis (NASH) and marked by liver cell injury, a mixed inflammatory infiltrate and variable fibrosis in the hepatic lobules [4].
Therefore, novel conceptually simple serologic biomarkers are necessitated to identify hepatic inflammation, discriminate SS seen in NAFLD from NASH non-invasively, and develop preventive measures. Genetic polymorphisms could be a worthy factor in the etiopathogenesis of human non-alcoholic fatty liver disease [5].
Cluster of Differentiation 14 (CD14), a 55-kDa glycoprotein, is a co-receptor with two forms: a soluble serum protein (sCD14) lacking the anchor protein and a glycosylphosphatidylinositolanchored membrane protein (mCD14). It is expressed in noticeable quantities upon the mature monocytes, macrophages, and neutrophils surfaces [6]. It is an effective mediator for monocytes activation in response to bacterial endotoxins. The serum CD14 levels are raised because of systemic reaction to bacterial invasion and endotoxin. Lipopolysaccharide (LPS) signaling elicits a cascade that provokes cytokine production and shedding of the CD14 extracellular domain (CD14) [7]. In fact, CD14 overexpression in the hepatic cells has been narrated as an indispensable element in the pathogenesis of NASH. This is because the overexpression of CD14 brings about hyper-responsiveness to low-dose LPS, which is antecedent to the progression from SS to NASH and is correlated with liver inflammation and fibrosis [8]. Kapil et.al acknowledged the genetic factors, such as polymorphisms of Toll-Like Receptor (TLR) and its co-receptor CD14, involvement in the pathogenesis of NAFLD [9]. Along these lines, the hepatic CD14 determination of expression may be advantageous to forecast the severity of liver inflammation in NASH and could be utilized as a routine test for assessing the deterioration of NAFLD patients to NASH as a substitute for liver biopsy.
The hypothesis of the current study is to assess the importance of CD14 in the early diagnosis of NAFLD as well as correlating its levels with hepatic inflammation and fibrosis. Likewise, another objective of this study is to explore the cause-effect relationship between CD14 SNP and the severity of NAFLD.
The present study is a prospective case control study conducted on 54 individuals their age ranged from 18-65 years. They were divided into 4 groups:
All participants aged above 18 years
Patients diagnosed with fatty liver by ultrasonography
Patients with significant alcohol consumption, Positive viral makers (HCV Ab and HBsAg), patients with symptoms or signs of hemochromatosis, alpha-one anti-trypsin deficiency, Wilson’s disease, autoimmune hepatitis, history of intake of steatogenic medications, patients with decompensated cirrhosis, severe renal failure, severe heart failure or pregnancy were all excluded.
Prior approval for the present study was granted by the Medical Research Ethical Committee-NRC, Cairo, Egypt (Approval No.16- 118). All participants provided written informed consent.
All patients and controls underwent clinical evaluation comprising detailed history taking incorporating the history of prior diseases, use of any medication, alcohol intake, and occupational exposure to chemicals, etc. BMI was calculated. Ultrasound system was used for the diagnosis of NAFLD based on the presence of bright liver (presence of liver steatosis), and the severity of the disease was categorized according to the NAFLD fibrosis score [10] and FIB-4 score [11].
10 ml of venous blood samples were drawn from each patient and control. Samples were allocated into two sets; the first set of samples was collected in K-EDTA tubes for DNA extraction. The second set was collected in plain tubes from which serum was separated through centrifugation at 3000 rpm for 10 min. This set was used for assessment of liver enzymes, serum albumin, renal function tests, lipid profile, and glycated hemoglobin (HbA1c) according to the manufacturer's instructions via commercial kits from Spectrum Company, Cairo, Egypt.
The serum concentration of CD14 was measured in samples that had been frozen at 80°C using an ELISA kit supplied by NOVA company (Beijing, China) as described in the pamphlet.
Quick g-DNA™ MiniPrep Zymo research extraction kit was used to isolate DNA from whole blood samples and the yield was quantified using a NanoDrop. The PCR cycle condition for CD-14 (C-159 T) was performed under standard conditions (35 cycles, annealing temperature: 61°C) in a total reaction volume of 50 μL, using the following pair of primers: forward 5’-ATCATCCTTTTCCCACACC-3’ and reverse: 5’- AACTCTTCGGCTGCCTCT-3’.
PCR products were digested with the corresponding restriction enzymes (HaeIII), and the resulting fragments were run on 2% Agarose gel and stained by ethidium bromide.
Quantitative variables are summarized as means ± standard deviation, whereas qualitative variables are summarized as numbers (percentage). The t-test was used for comparisons between two groups of subjects. Also, the ANOVA test was used test for comparisons of more than two independent groups. Spearman’s correlation coefficient (r) was applied to determine the correlations between serum CD14 levels and the other biomarkers. The diagnostic values of CD14 for predicting NAFLD were assessed using the area under the ROC curves (AUC). The turning point in the curve was determined as the best cut-off value for diagnosis. All statistical analyses were done using SPSS software version 23.0 (SPSS, Inc., Chicago, IL). P-values less than 0.05 were considered statistically significant.
This study involved 40 NAFLD patients and fourteen age-matched lean healthy control subjects. The detailed demographic, anthropometric, and biochemical characteristics of the studied groups are summarized in (Tables 1 and 2).
| Parameters | Healthy control group (N=14) | NAFLD patients (N=41) | P-value | ||
| Age (Years) | 48.86 ± 10.08 | 47.66 ± 11.56 | 0.731 | ||
| Sex (male/female) | 5/9 | 2/39 | 0.009** | ||
| Female % | 64.30% | 95.10% | |||
| BMI (kg/m2 ) | 23.8 ± 1.5 | 31.94 ±7.73 | <0.001*** | ||
| HbA1C (%) | 5.76 ± 1.16 | 6.42 ± 1.1 | 0.085 | ||
| ALT (U/L) | 23.07 ± 5.43 | 23.74 ± 8.93 | 0747 | ||
| AST (U/L) | 21.36 ± 4.25 | 22.5 ± 6.44 | 0542 | ||
| GGT (U/L) | 41.62 ± 12.29 | 47.08 ± 40.82 | 0.639 | ||
| ALP (U/L) | 100.39 ± 29.97 | 106 ± 46.08 | 0.685 | ||
| ALB (g/dl) | 3.94 ± 0.33 | 3.71 ± 0.50 | 0.122 | ||
| TP (g/dl) | 7.35 ± 0.21 | 7.28 ± 0.42 | 0.47 | ||
| Total bilirubin (mg/dl) | 0.55 ± 0.19 | 0.59 ± 0.39 | 0.717 | ||
| Direct bilirubin (mg/dl) | 0.054 ± 0.05 | 0.16 ± 0.36 | 0.304 | ||
| Urea (mg/dl) | 22 ± 3.97 | 36.14 ± 49.07 | 0.308 | ||
| Creatinine (mg/dl) | 0.746 ± 0.11 | 1.26 ± 1.84 | 0.091 | ||
| Na+ (mmol/l) | 135 ± 3.24 | 137.2 ± 4.23 | 0.093 | ||
| K+ (mmol/l) | 4.19 ± 0.37 | 4.36 ± 0.59 | 0.344 | ||
| Uric acid (mg/dl) | 4.41 ± 0.87 | 5.51 ± 2.69 | 0.038* | ||
| Cholesterol (mg/dl) | 150.9 ± 17.83 | 194.15 ± 51.48 | 0.004** | ||
| Triglycerides (mg/dl) | 99.43 ± 21.62 | 225.47 ± 313.2 | 0.026 | ||
| LDL | 93.5 ± 13.63 | 101.1 ± 35.57 | 0.298 | ||
| HDL | 49.2 ± 7.49 | 49.76 ± 14.76 | 0.868 | ||
| RBCs (χ106 /µL) | 4.076 ± 0.29 | 4.3 ± 0.547 | 0.057 | ||
| Hb (g/dl) | 12.11 ± 0.99 | 11.93 ± 1.76 | 0.639 | ||
| PLT (χ103 /µL)s | 264.7143 ± 50.185 | 261.5744 ± 210.62 | 0.958 | ||
| WBCs (χ103 /µL) | 10.103 ± 2.438 | 7.657 ± 4.05 | 0.038* | ||
| NAFLD Fibrosis Score (NFS) | -2.733 ± 0.887 | -1.04 ± 2.87 | 0.036** | ||
| FIB-4 score | 0.55 ± 0.39 | 1.896 ± 3.58 | 0.169 | ||
| CD-14 (ng/ml) | 2.21 ± 1.8 | 7.7 ± 7.09 | <0.001** | ||
| a: significant difference from healthy controls; *: P ≤ 0.05, **: P ≤ 0.01, ***: P ≤ 0.001 | |||||
.
| Parameters | Control group (N=14) | Obese diabetic group (N=15) | Diabetic Non-obese group (N=14) | Obese Non-diabetic group (N=12) | |
| Age (Years) | 48.86 ± 10.08 | 47.4 ± 13.69 | 47.29 ± 13.78 | 48.42 ± 4.69 | |
| Sex (male/female) | 5/9 | 0/15 a** | 1/13 | 1/11 | |
| Female % | 64.30% | 100% | 92.90% | 91.70% | |
| BMI (kg/m2) | 23.8 ± 1.5 | 34.13 ± 4.1 a*** | 24.13 ± 1.08b*** | 38.9 ± 7.86,ac*** | |
| HbA1C (%) | 5.76 ± 1.16 | 6.7 ± 0.76 | 7.17 ± 1.26 a** | 5.7 ± 0.62 c** | |
| ALT (U/L) | 23.1 ± 5.43 | 23.5 ± 10.75 | 21.92 ± 6.42 | 25.8 ± 9.06 | |
| AST (U/L) | 21.36 ± 4.25 | 19.7 ± 6.69 | 22.75 ± 6.03 | 25.5 ± 5.52b* | |
| GGT (U/L) | 41.62 ± 12.29 | 57.6 ± 63.34 | 37.27 ± 11.1 | 42.92 ± 11.05 | |
| ALP (U/L) | 100.4 ± 29.97 | 99.5 ± 52.2 | 103.5 ± 36.12 | 115.5 ± 50.2 | |
| ALB (g/dl) | 3.9 ± 0.33 | 3.66 ± 0.62 | 3.8 ± 0.54 | 3.68 ± 0.28 | |
| TP (g/dl) | 7.35 ± 0.21 | 7.41 ± 0.44 | 7.32 ± 0.5 | 7.09 ± 0.22 b* | |
| Total bilirubin (mg/dl) | 0.55 ± 0.19 | 0.66 ± 0.59 | 0.49 ± 0.15 | 0.59 ± 0.19 | |
| Direct bilirubin (mg/dl) | 0.054 ± 0.05 | 0.33 ± 0.55 a* | 0.09 ± 0.075 b* | 0.03 ± 0.045 b* | |
| Urea (mg/dl) | 22 ± 3.98 | 60.38 ± 77.3 a* | 20.36 ± 3.96 b* | 24.3 ± 5.5 b* | |
| Creatinine (mg/dl) | 0.75 ± 0.11 | 1.85 ± 2.55 | 1.12 ± 1.57 | 0.7 ± 0.17 | |
| Na+ (mmol/l) | 135 ± 3.24 | 136.1 ± 4.98 | 137.8 ± 2.88 | 137.9 ± 4.39 | |
| K+ (mmol/l) | 4.19 ± 0.37 | 4.59 ± 0.83 | 4.28 ± 0.38 | 4.2 ± 0.25 | |
| Uric acid (mg/dl) | 4.4 ± 0.87 | 5.84 ± 3.69 | 4.97 ± 1.98 | 5.45 ± 1.49 | |
| Cholesterol (mg/dl) | 150.9 ± 17.84 | 175.4 ± 17.46 | 209.33 ± 76.7 a** | 194.58 ± 35.22 a* | |
| Triglycerides (mg/dl) | 99.4 ± 21.6 | 192.2 ± 138.3 | 323.1 ± 504.4 a* | 155.58 ± 86.3 | |
| LDL (mg/dl) | 93.5 ± 13.6 | 103 ± 24.1 | 84.5 ± 43.17 | 114.6 ± 32.21 | |
| HDL (mg/dl) | 49.2 ± 7.49 | 44.3 ± 19.8 | 57 ± 9.44 | 47.7 ± 12.1 | |
| WBCs (χ103 /µL) | 10.1 ± 2.4 | 10.2 ± 5.08 | 5.89 ± 2.4 ab** | 6.56 ± 2.46 ab** | |
| RBCs (χ106 /µL) | 4.08 ± 0.29 | 4.06 ± 0.55 | 4.43 ± 0.5 | 4.5 ± 0.53 ab* | |
| Hb(g/dl) | 12.1 ± 0.99 | 11.56 ± 1.65 | 12.34 ± 2 | 11.9 ± 1.6 | |
| PLT (χ103 /µL)s | 264.714 ± 59.185 | 341.333 ± 317.116 | 177.254 ± 77.44 b* | 260.250 ± 92.283 | |
NAFLD fibrosis score (NFS) |
-2.73 ± 0.89 | -1.38 ± 4.1 | -0.35 ± 1.54 a* | -1.32 ± 1.98 | |
| FIB-4 score | 0.55 ± 0.047 | 1.55 ± 1.69 | 3.11 ± 6.15 a* | 1.1 ± 0.58 | |
| CD-14 (ng/ml) | 2.21 ± 1.8 | 9.31 ± 7.29 a** | 7.99 ± 8 a* | 5.75 ± 5.76 | |
| Total bilirubin(mg/dl) | 0.55 ± 0.19 | 0.66 ± 0.59 | 0.49 ± 0.15 | 0.59 ± 0.19 | |
| Direct bilirubin (mg/dl) | 0.054 ± 0.05 | 0.33 ± 0.55 a* | 0.09 ± 0.075 b* | 0.03 ± 0.045 b* | |
| Urea (mg/dl) | 22 ± 3.98 | 60.38 ± 77.3 a* | 20.36 ± 3.96 b* | 24.3 ± 5.5 b* | |
| Creatinine (mg/dl) | 0.75 ± 0.11 | 1.85 ± 2.55 | 1.12 ± 1.57 | 0.7 ± 0.17 | |
| Na+ (mmol/l) | 135 ± 3.24 | 136.1 ± 4.98 | 137.8 ± 2.88 | 137.9 ± 4.39 | |
| K+ (mmol/l) | 4.19 ± 0.37 | 4.59 ± 0.83 | 4.28 ± 0.38 | 4.2 ± 0.25 | |
| a: significant difference from healthy controls; b: significant difference from Obese diabetic group; c: significant difference from Diabetic Non-obese group. | |||||
Overall, there was a statistically significant increase in serum CD14 levels in NAFLD cases compared to healthy control 7.44 ± 6.99 ng/ml vs. 2.21 ± 1.8 ng/ml, P<0.001). In addition, serum level of CD14 was significantly higher in the diabetic subjects either obese or lean compared to healthy subjects (8.6 ± 7.14 ng/ml and 7.99 ± 8 ng/ml vs. 2.21 ± 1.8 ng/ml, P < 0.05; Table 2). However, no statistically significant difference was detected in CD14 of NAFLD patients without diabetes when compared to healthy controls (5.75 ± 5.76 ng/ml vs. 2.21 ± 1.8 ng/ml, P > 0.05; Table 2).
Furthermore, serum CD14 was positively correlated with cholesterol, triglyceride, and RBCs of the participants (r=0.644, P<0.001, r=0.747, P<0.001, r=0.355, P=0.011; respectively). It also negatively correlated with age, LDL, and platelet counts (r=- 0.541, P<0.001, r=-0.351, P=0.02 and r=-0.345, P<0.013) (Table 3).
| Parameters | Concentration of CD14 (ng/ml) |
|
| R | P-value | |
| Age(Yrs.) | -0.517 | <0.001*** |
| BMI (kg/m2 ) | 0.02 | 0.887 |
| FIB-4 score | 0.061 | 0.673 |
| NFS | 0.226 | 0.115 |
| HbA1c (per gm %) | 0.252 | 0.112 |
| ALT (U/L) | 0.016 | 0.915 |
| AST (U/L) | -0.198 | 0.169 |
| GGT (U/L) | 0.343 | 0.017* |
| ALP (U/L) | 0.024 | 0.875 |
| ALB (g/dl) | -0.12 | 0.408 |
| TP (g/dl) | 0.406 | 0.004** |
| Total bilirubin (mg/dl) | 0.066 | 0.651 |
| Direct bilirubin (mg/dl) | 0.402 | 0.004** |
| Urea (mg/dl) | 0.301 | 0.042* |
| Creatinine (mg/dl) | 0.248 | 0.086 |
| Na+ (mmol/l) | 0.103 | 0.481 |
| K+ (mmol/l) | 0.333 | 0.019* |
| Uric acid (mg/dl) | 0.275 | 0.0687 |
| Cholesterol (mg/dl) | 0.628 | <0.001*** |
| Triglycerides (mg/dl) | 0.73 | <0.001*** |
| LDL | -0.303 | 0.043* |
| HDL | -0.092 | 0.546 |
| WBCs (103 /µL) | 0.296 | 0.033* |
| RBCs (106 /µL) | 0.283 | 0.042* |
| Hemoglobin (g/dl) | -0.108 | 0.445 |
| platelet count (103 /µL) | -0.333 | 0.016* |
| CD-14 polymorphism | -0.109 | 0.441 |
As expected, CD14 was associated with non-alcoholic fatty liver disease. ROC curve showed the optimum cutoff value (COV) for CD14 was 2.97 (ng/ml) for distinguishing patients with NAFLD from healthy control with sensitivity 76.3% and specificity 78.6%; an AUROC was 0.821(95% CI: 0.699-0.944) (p< 0.001) (Figure 1). On the other hand, there is no diagnostic accuracy of serum CD14 in the detection of patients with NFS< -1.455 from those who had NFS ≥ -1.455 (P=0.984) (Figure 2). At a cutoff value 7.098 (ng/mL), serum CD14 gave a diagnostic sensitivity of 37.9% and a diagnostic specificity of 71.4% and AUROC was Based on the ROC curve, CD14 was not effective for discriminating patients with NFS ≤ 0.676 from those with NFS>0.676. At cutoff 3.19 (ng/ml) the sensitivity was 100% but specificity decreased to reach 37% (p=0.571) (Figure 3).
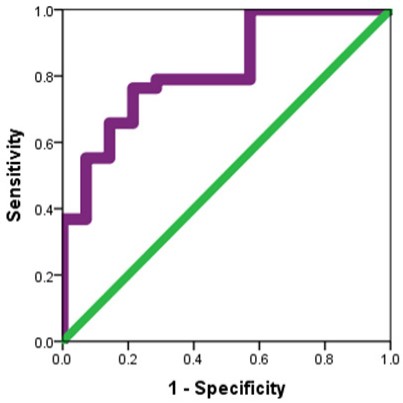 Figure 1: ROC curve of CD14 (ng/ml) to differentiate between patients with
NAFLD fibrosis Score < -1.455 from those with NAFLD fibrosis Score ≥ -1.455.
Figure 1: ROC curve of CD14 (ng/ml) to differentiate between patients with
NAFLD fibrosis Score < -1.455 from those with NAFLD fibrosis Score ≥ -1.455.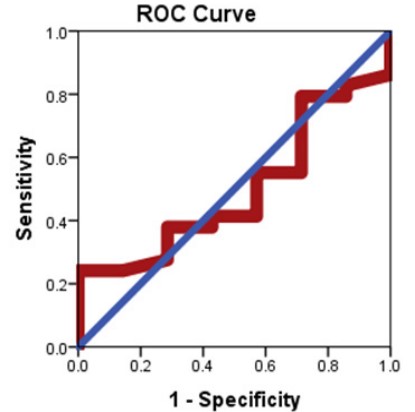 Figure 2: Plain abdominal and chest radiography
showed enormously distended bowel.
Figure 2: Plain abdominal and chest radiography
showed enormously distended bowel.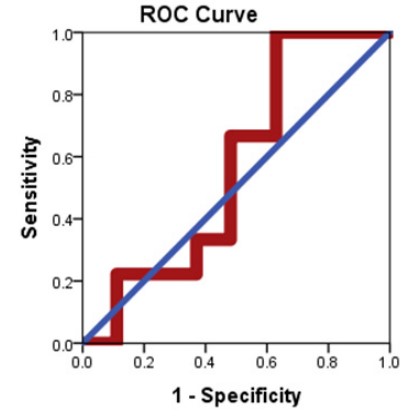 Figure 3: Plain abdominal and chest radiography
showed enormously distended bowel.
Figure 3: Plain abdominal and chest radiography
showed enormously distended bowel.Also, it is not effective in the detection of patients with FIB-4 < 1.3 from those with FIB-4 > 1.3, (P=0.882) (Figure 4) or patients with Fib-4 score < 2.67 from those with Fib-4 score >2.67 (P=0.940) (Figure 5).
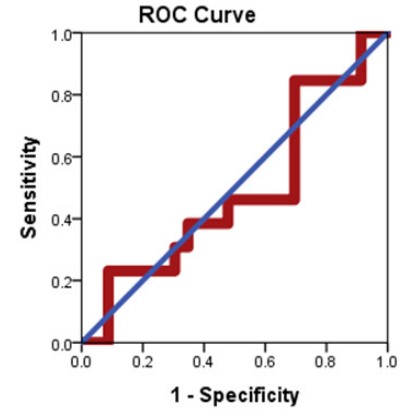 Figure 4: ROC curve of CD14 (ng/ml) to differentiate between patients with
FIB-4 < 1.3 from those with FIB-4 ≥1.3.
Figure 4: ROC curve of CD14 (ng/ml) to differentiate between patients with
FIB-4 < 1.3 from those with FIB-4 ≥1.3.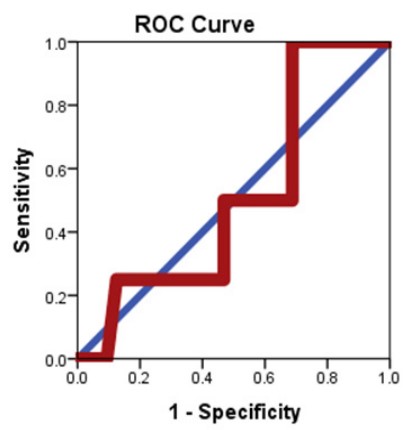 Figure 5: ROC curve of CD14 (ng/ml) to differentiate between patients with
FIB-4≤ 2.67 from those with Fib-4 score >2.67.
Figure 5: ROC curve of CD14 (ng/ml) to differentiate between patients with
FIB-4≤ 2.67 from those with Fib-4 score >2.67.Next, the CD14 genotype distribution was analyzed in NAFLD patients as well as in healthy controls. The prevalence of CD14 genotypes was not significantly different between all patients with NAFLD and control subjects. The genotype distribution was CC: 10/40 (25%), CT: 21/40 (52.5%), and TT: 9/40 (22.5%) in NAFLD cases vs. (CC: 2/14 (14.3%), CT: 6/14 (42.9%), and TT: 6/14 (42.9%) in healthy controls) (P=0.175) (Table 4 and Figure 6).
| CD14-159C/T genotype | CC | CT | TT | P-value |
| Cases (n=41) | 10 (24.4%) | 22 (53.7%) | 9 (22%) | 0.366 |
| Control (n=14) | 2 (14.3%) | 6 (42.9%) | 6 (42.9%) |
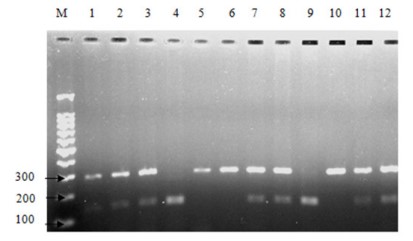 Figure 6: Polymorphism analysis of CD14-159C/T. Representative Agarose
gel picture of PCR-RFLP assay with restriction digested products. Lane M:
100 bp DNA ladder; Lanes 1-12: RE digested product, CC: 141 bp and 154 bp
(Lanes 4, 9), CT: 296 bp, 141 bp, and 154 bp (Lanes 1, 2, 3, 7, 8, 11 and 12),
TT: 296 bp (Lanes 5, 6, and 10).
Figure 6: Polymorphism analysis of CD14-159C/T. Representative Agarose
gel picture of PCR-RFLP assay with restriction digested products. Lane M:
100 bp DNA ladder; Lanes 1-12: RE digested product, CC: 141 bp and 154 bp
(Lanes 4, 9), CT: 296 bp, 141 bp, and 154 bp (Lanes 1, 2, 3, 7, 8, 11 and 12),
TT: 296 bp (Lanes 5, 6, and 10).Genotyping of forty patients with NAFLD revealed that there were thirty patients carried the T allele CD14/159 at the CD14 SNP; twenty-one of them were heterozygous (CT) and the remaining nine were homozygous (TT) for CD14/159 allele. The resulting allele frequency was 0.487.
Comparing TT-homozygote NAFLD patients and NAFLD patients with genotype CC or CT. we found no differences in demographic features such as age (50 ± 7.38 years vs 47.0 ± 12.5 years (P=0.499)] and BMI [33.56 ± 9.98 kg/m2 vs 31.47 ± 7.07 kg/m2 (P=0.484)).
However, the TT CD14 polymorphism in NAFLD patients was associated with significantly higher serum levels of ALT, and AST in NAFLD subjects compared to those with genotype CC or CT (28.89 ± 10.15 U/L vs. 22.14 ± 8.05 U/L (P=0.046), and 27.11 ± 6.85 U/L vs 21.1 ± 5.7 U/L (P=0.012), respectively).
(Table 5) showed that the frequency of the CD14 genotypes was similar in NAFLD patients with NFS≤0.676 and patients with NFS>0.676 (7/31 (22.6%) vs 2/9 (22.2%), (P=1) respectively.
| NAFLD patients | P-value by (χ2 test) | |||
| with NAFLD fibrosis Score ≤ 0.676 | with NAFLD fibrosis Score > 0.676 (N=9 | |||
| CC+CT (N=32) | N | 25 | 7 | 1 |
| % | 78.10% | 77.80% | ||
| TT (N=9) | N | 7 | 2 | |
| % | 21.90% | 22.20% | ||
Also, the comparison of NFS and FIB-4 score between NAFLD patients with TT-homozygotes and those with genotype CC or CT revealed that there was no significant difference between the two groups regarding both scores (0.071 ± 1.11 vs -1.38 ± 3.16 (P=0.188), and 3.65 ± 7.08 vs 1.37 ± 1.31, (P=0.365) respectively).
Moreover, this study demonstrated that the TT-homozygote NAFLD patients (n=9) had significantly lower CD14 serum levels than NAFLD patients with -159 CD14 genotype CT or CC (n=31), respectively (4.9 ± 2.77 ng/mL vs 8.57 ± 7.8 ng/mL; P=0.04).
NAFLD nowadays stands as the commonest liver disease as its prevalence is surging: estimated 20-30% in the general population, and can approximate to 70-90% in obese and diabetic patients [12, 13]. It has a strong link to a number of illnesses, the most prevalent of which are type 2 diabetes, obesity, hypertension, Insulin Resistance (IR), and dyslipidemia, and is referred to as the "hepatic manifestation of metabolic syndrome" [14]. Despite the fact that there are no particular guidelines for the treatment of NAFLD, the majority of recommendations were directed at treating related illnesses such as obesity through weight loss and diabetes through strict glycemic and lipid control [15].
Unfortunately, there are conflicting conclusions in the literature around the role of gender in the occurrence of NAFLD. Many studies stated a higher prevalence rate in men whereas others proposed the opposite [16].
Also, it is mentioned previously that NAFLD is more likely to affect women more than men, in particular, among the postmenopausal women [17]. In this study, RBCS was found to be significantly higher in NAFLD patients compared to healthy controls. This was also discovered in a study by Zhong, et al., who discovered that a high RBC count was independently linked to a high risk of NAFLD onset and progression [18].
Another cross-sectional study by Jiang et al. (2014) and Motamed et al. (2020) found a positive connection between Red Blood Cell (RBC) count and fatty liver index [19], demonstrating a good ability to differentiate persons with NAFLD from those without it [20].
It was assumed that certain substances secreted by RBCs may play a role in the onset and progression of NAFLD.
Recent studies declared that RBCs have been found as a major source of sphingosine 1-phosphate (S1P) in plasma [21]. Sphingosine can be integrated into RBCs and then converted to S1P, and a considerable amount of S1P in RBCs can leak out even when the RBCs are not stimulated [22]. Naturally, as the number of RBCs in the blood increased, so did the amount of S1P released into the blood [23]. S1P is now becoming recognized as a factor in the pathobiology of the liver, particularly NAFLD [24]. S1P in the extracellular environment binds to S1PR2 on hepatocytes, resulting in decreased insulin signalling and Insulin Resistance (IR) [25]. According to Chen et al., treatment with S1P dramatically increased hepatic lipid storage [26].
Because the number of RBCs in the blood plays a significant role in blood viscosity, blood viscosity rises as the number of RBCs rises [27]. Higher blood viscosity may reduce blood flow and, as a result, oxygen circulation, glucose, and insulin decrease to vital tissues including skeletal muscle [28,29]. Vasodilation, blood pressure raising, and other compensatory processes will then enhance blood flow. When these pathways fail, an increase in glucose and insulin is required to enhance glucose and insulin transport to skeletal muscle, which can lead to insulin resistance [30,31]. Furthermore, insufficient oxidation capacity is caused by limited oxygen delivery. According to growing research, insufficient oxidative capacity of muscle is the primary cause of insulin resistance [32]. Third, the lipid profile of the erythrocyte membrane could be another mechanism relating RBC count to NAFLD.
Along with toll-like receptor 4, CD14, a 55-kDa glycoprotein, is a co-receptor for lipopolysaccharide. It's mostly found on macrophages, although it's also found on neutrophils and dendritic cells. CD14 is assumed to be a general marker of inflammation. LPS triggers a cascade that provokes cytokines production and incites the shedding of the extracellular domain of CD14 (CD14 ECD) [6,33].
Noteworthy up-regulation of CD14 expression in Kupffer cells has been implicated in inflammatory liver diseases. It can be upregulated with LPS [34]. In the present study, CD14 levels were shown to be higher in the sera of NAFLD patients, particularly those with a history of diabetes, whether lean or obese. This is consistent with the findings of Fernández-Real et al., who hypothesized that systemic CD14 expression could play a role in obesity and inflammation-induced insulin resistance [33].
Additionally, there was no association between CD14 and NFS; suggesting that it may reflect macrophage status in general rather than liver-specific disease. Previous research has postulated that the proliferation of tiny intestine bacteria inNAFLD after pancreatoduodenectomy may play a role in NASH etiopathogenesis, primarily through the generation of LPS by a component of the gram -ve bacterial population [34].
In addition, previous research has shown that Kupffer cells are much more abundant and LPS-induced CD14+ Kupffer cells are increased in NAFLD following pancreatoduodenectomy specimens compared to NAFLD associated with metabolic syndrome specimens [34].
Patients with chronic liver disease were shown to have a wide range of etiologies. According to novel studies, natural history of chronic liver disease is influenced by multiple linked Single Nucleotide Polymorphisms (SNPs) [35].
Genetic studies now gain attention to elucidating variation in response to the same etiologic agent seen in these individuals. Lately, the C/T (-159) polymorphism observed at the CD14 promoter region was pinpointed as a risk factor for either development or progression of NAFLD.
As a result, the goal of this study was to look at CD14 gene polymorphisms in NAFLD patients and see how they contributed to the disease's cause and severity. We didn’t find an association between the prior polymorphism and the occurrence of NAFLD. Besides, this polymorphism did not influence disease severity, as there was no difference in NFS and FIB-4 score amongst those with and without polymorphism. Previous Greek study confirmed the predominant of TT genotype in Alcoholic Liver Disease (ALD) cases compared to NAFLD or healthy individuals. Likewise, Nezi et al. study displayed an absence of association between CD14 polymorphism and the stage of liver disease, rendering it not influence in detecting disease severity at endstages liver disease [36].
Such an assumption was similarly postulated by Jarvelainen and his colleagues who also could not detect any association between the CT-159 genotypes and less advanced stages of fibrosis, simple steatosis, in alcoholic liver disease patients [37].
In contrast, other published studies indicated that the distribution of TT genotype in NASH patients was considerably higher than that in control individuals [38,39]. Whether geographical differences play an important role is unknown; this may be a matter of future large population studies.
The mechanism by which the genomic variation in CD14 may contribute to the pathogenesis and progression of NAFLD is not entirely comprehended. Preceding reports have hypothesized that transcription of T allele increased significantly in patients with NAFLD thus it may be considered a risk factor for this disease [40]. CD14 overexpression in macrophages would boost LPS-inducible cytokine expression, perhaps enhancing Th1 inflammatory responses [41]. Experimental studies displayed that that mice deficient in CD14 receptor are resistant to the liver injury induced by ethanol [42]. Whether CD14 polymorphism may be a protective factor for the development of liver disease is still an argument.
Based on the findings of this study, it is feasible to hypothesize that serum levels of CD14 can be used as diagnostic indicators in cases with NAFLD illness, as CD14 levels rise as the disease progresses. However, it did not correlate with the NAFLD fibrosis score of those patients.
In addition, our study did not find any association between CD14 C (-159) T polymorphism and the risk of NAFLD development. Reports with a larger cohort of patients are demanded to validate the results. Likewise, the influence of therapeutic interventions for instance weight loss on the levels of these parameters is needed to be elaborated in future studies.
The small size of this study was due to the cost of kits for the biochemical investigations; we recommend to increase the number of patients in future studies.
Although abdominal ultrasonography has low sensitivity for detecting mild NAFLD as reported in previous literature, it is the best low cost available non-invasive technique to detect NAFLD. Because of ethical considerations, we did not carry out a liver biopsy (none of our patients had severe clinical state of disease). Moreover, our studied patients considered themselves healthy and refused to undergo further invasive technique like pathological examinations for liver biopsy to detect fibrosis, besides enrolled controls were selected carefully and they haven’t any risk factor for NAFLD development.
This work is free of any conflicts of interest.
We would like to acknowledge National Research Centre for technical supporting the current research.

